Language: C Programming Language
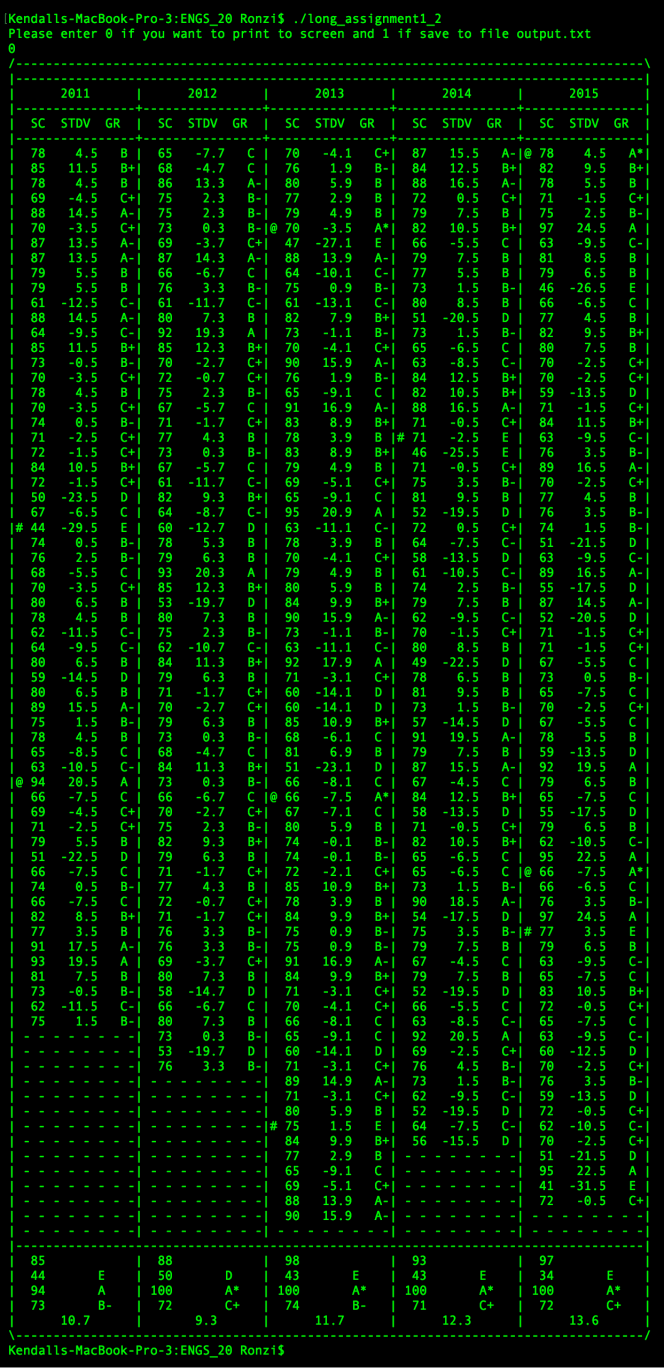
Assignment: You have been given the task of making a table that clearly shows the exam scores of your professor’s students over the past five years. The scores are contained in five separate files (2011.txt, 2012.txt, etc.). Your job is to read the scores from these files and make a clear and simple table displaying the exam scores and some summary information. The first column in each year is the exam score found in the appropriate file. The second column is the signed difference from the mean of the exams from that year, in units of standard deviation (based on Gaussian distribution). The third column is the letter grade according to a ”curve” given. In addition, there are five rows of summary data at the bottom of the table. The first row is simply the number of scores in each file. The next two lines show the low and high scores for that year. The second-to-last row shows the average of the scores for each year and the corresponding average letter grade. The final row shows the standard deviation of the exam scores in each file.
(The image below was cropped in the middle to be more legible)